


Attenuators are elements of an electrical circuit that are used to decrease the amount of power delivered to the next stage of the circuit. An ideal attenuator would have a flat frequency response, that is, it would decrease the amplitude of all input signals equally, regardless of the frequency.
In this note, we are going to use the tracking generator (TG) function of a SIGLENT SVA1015 Spectrum Analyzer to test an unknown attenuator. The TG provides a sine wave signal with a known amplitude across a range of frequencies and we can measure the response of the device-under-test (DUT).
We also have a video here: Attenuator Verification Video
Hardware:
- SIGLENT SVA1015X Spectrum and Vector Network Analyzer*
- Qty 2 coaxial cables (N-type on one end for connection to the SVA, the other end should match your attenuator connections)
- Attenuator to test (note the connector types)
- Qty 1through, or barrel, adapter
*This method applies to the SIGLENT SSA3000X series as well
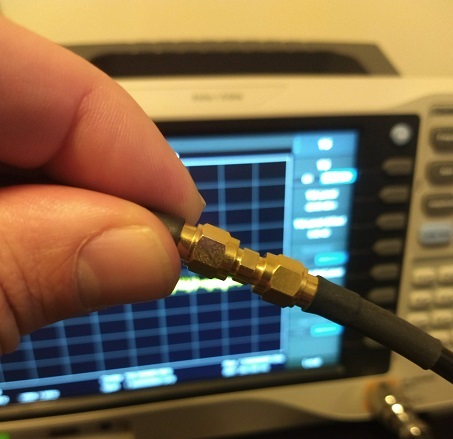
In this note, we are testing this attenuator:
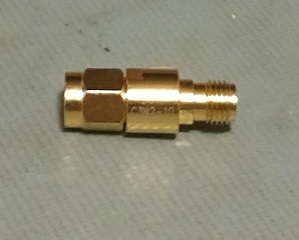
Notice that it terminates in SMA connections.
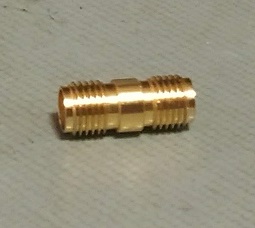
So, we will need an SMA-to-SMA through adapter to properly test the attenuator:
Initial Steps:
1. Power on and warm up the analyzer
2. Connect a cable to the TG output of the analyzer
3. Connect a cable to the RF input of the analyzer
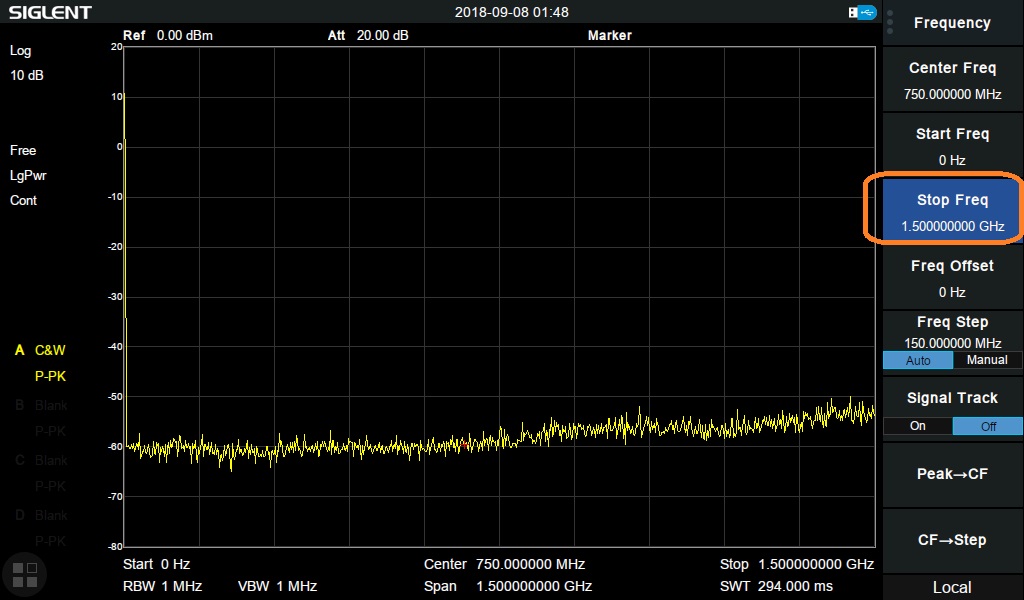
4. Set the frequency range of interest. In this case, we want to see the attenuator functionality across as wide a frequency range as possible. The SVA TG starts at 5 MHz and operates up to 1.5 GHz, so we can press FREQUENCY on the front panel (or display, as the SVA has a touch screen) and set this to 1.5 GHz:
Optional: You can change the TG amplitude if the -20 dBm default is not appropriate for your testing.
Normalize:
Normalization is a step that helps minimize measurement errors added by the cables, adapters, and connectors that are in the test circuit.
The process is simple: Connect all of the cabling and adapters required to test the device, in place of the device, use a high-quality through-adapter and start the test. The result will include the effects of the cabling and any adapters used. We can then “normalize” these effects by activating normalization on the instrument. This function subtracts the result of the sweep from itself, point-by-point and displays a new normalized curve. When we then add the device-under-test (DUT) to this circuit, we will directly see the effects. In this example, if the steps are executed properly, the normalized curve will show up as a line at 0 dB and we can continue.
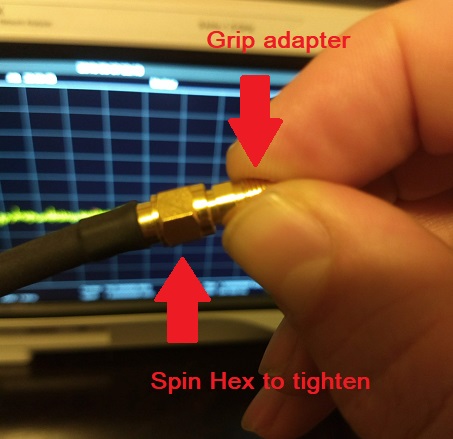
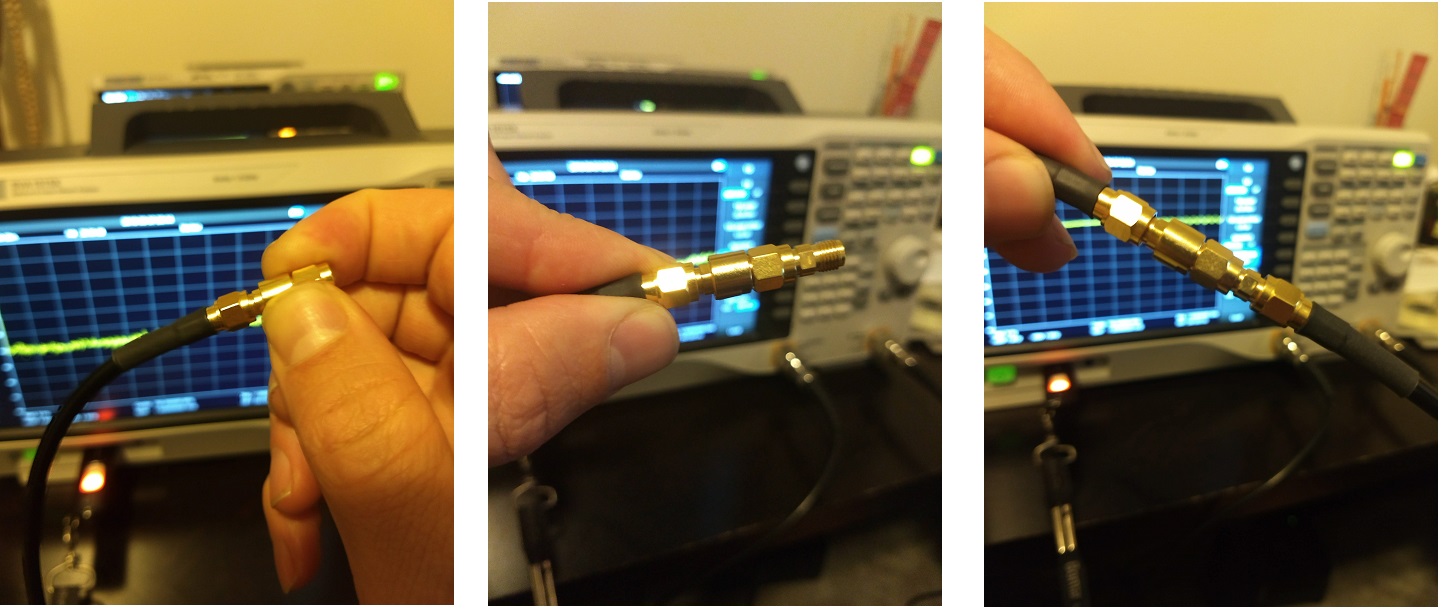
1. Connect the TG output cable to the RF input cable using the SMA through adapter.
NOTE: To avoid damaging connections, grip the adapter and spin the hex cable end to tighten. Spinning the adapter can quickly damage connectors.
2. Enable the tracking generator (TG) output by pressing TG > TG ON
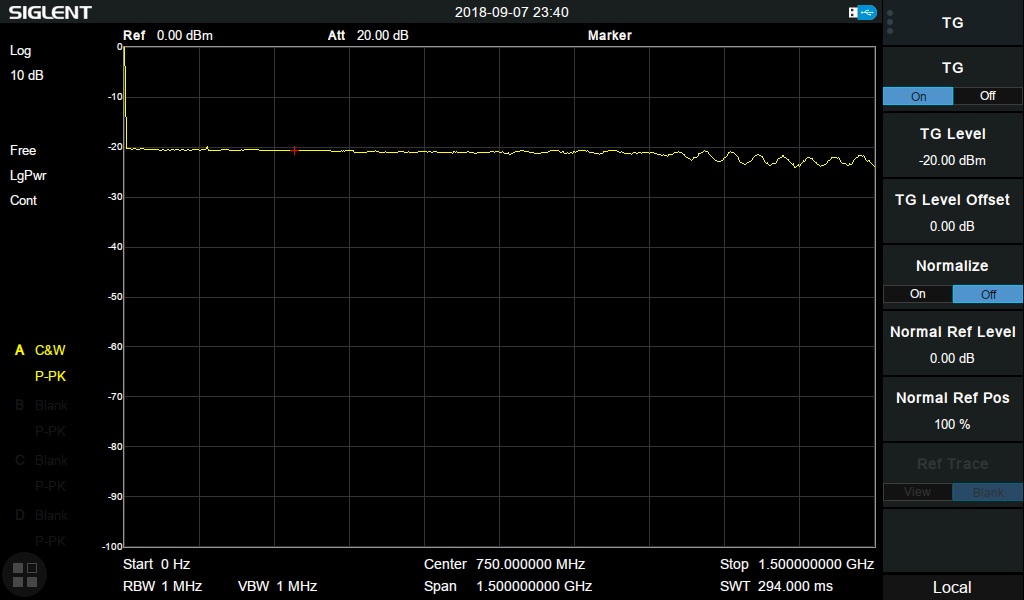
Here, you can see that the TG output amplitude is set to -20 dBm, and the measured power that we read on the RF measurement side is approximately -20 dBm. The line isn’t perfectly flat because of the effects of the cabling and adapters.
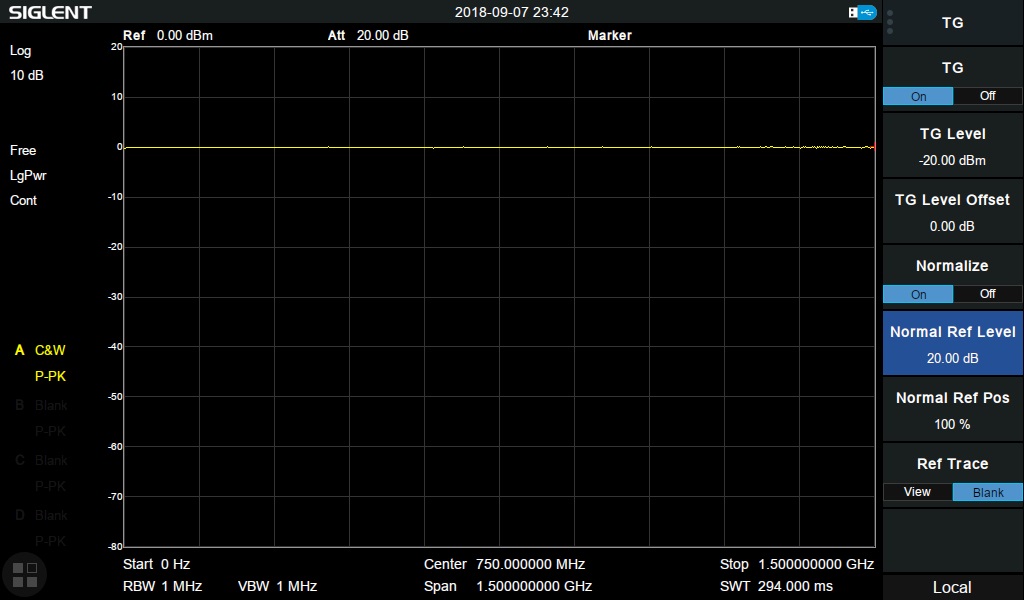
3. Enable Normalize by setting Normalize > ON
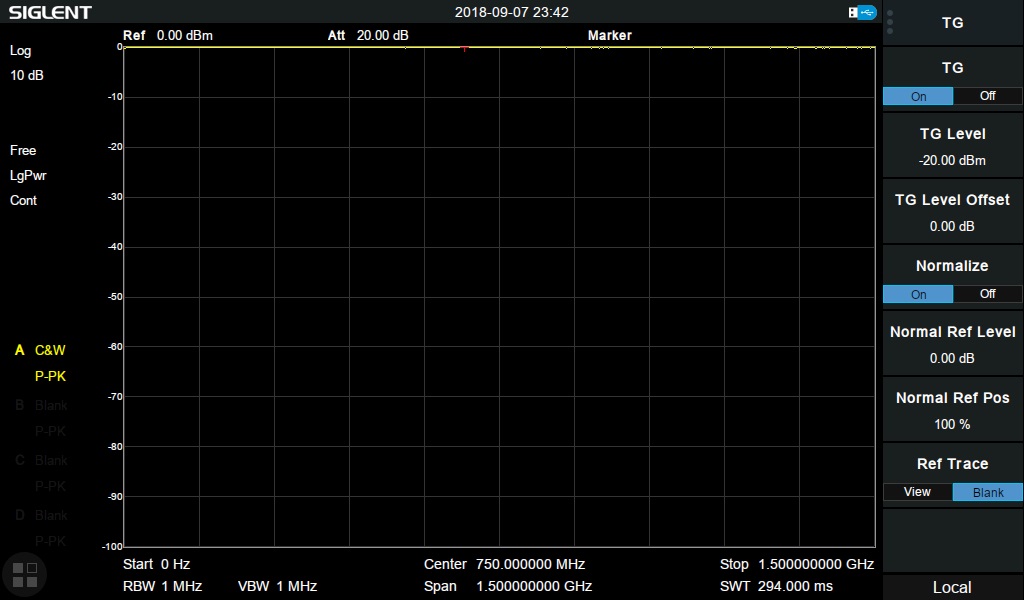
Remember that when we activate normalization, we are subtracting the measured curve from itself which results in a flat line at 0 dB. The normalized curve is now located at the top of the screen.
4. Adjust the graph so that you can observe the normalized curve by changing the Normal Ref Level:
Test the DUT:
1. Remove the through adapter from the TG output cable
2. Attach the DUT to the TG output cable
3. Attach the through adapter to the end of the DUT:
NOTE: To avoid damaging connections, grip the adapter and spin the hex cable end to loosen. Spinning the adapter can quickly damage connectors.
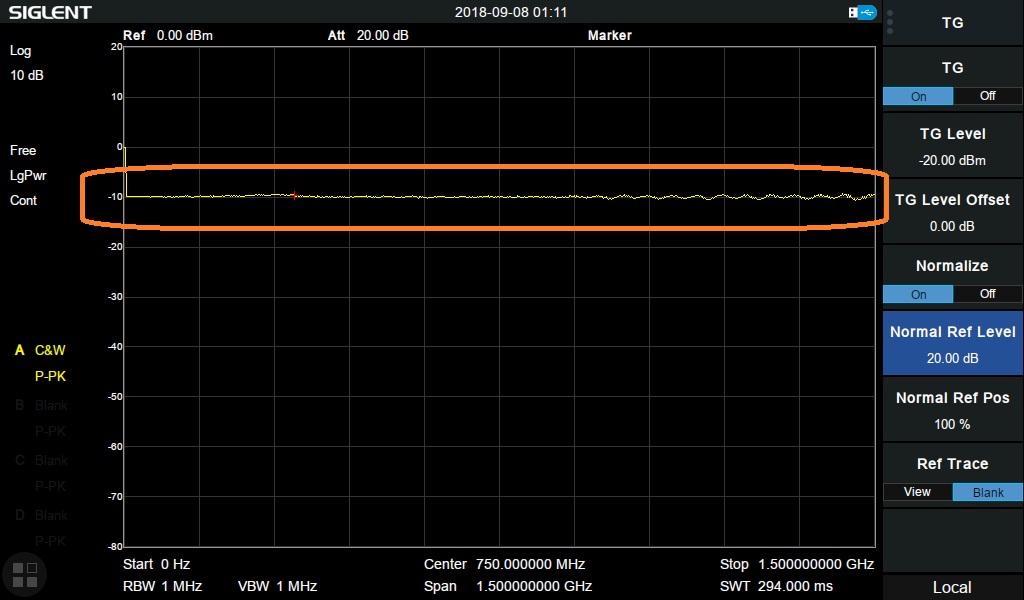
4. Now, the displayed data represents the attenuators influence on the signal. Without the attenuator, we were reading 0 dB. Now, we are reading -10 dB. Therefore, this is a 10 dB attenuator.. with fairly flat response up to 1.5 GHz as shown: